Textile - Spinning
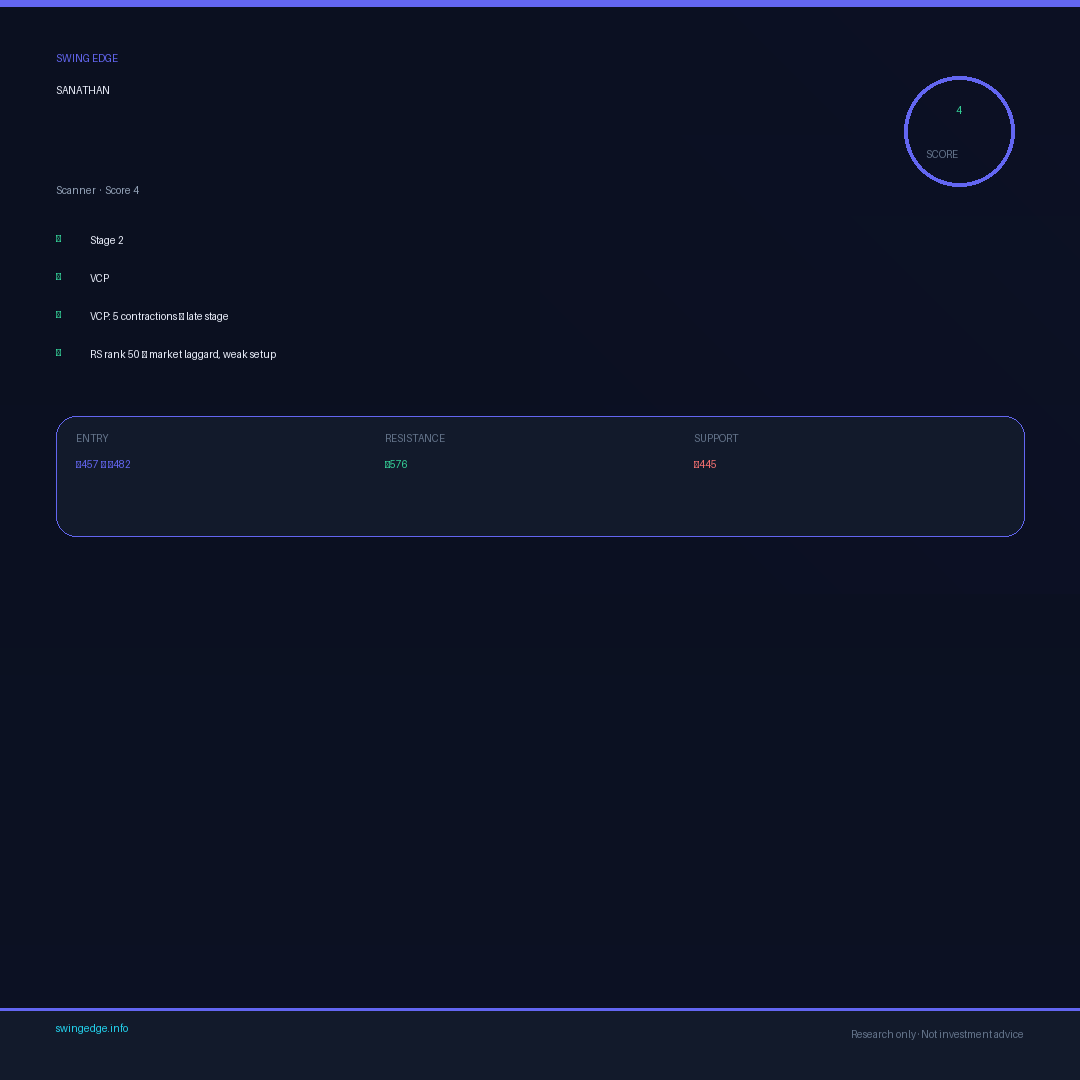
SANATHAN
Sanathan Textiles Ltd.
Caution — weak structure
Setup readiness
Early Trend
- Entry Zone
- ₹457.1-482.4
- Support Level
- ₹444.7
- Resistance
- ₹576.0
- Risk / Reward
- 2.5 : 1
- Risk Distance
- 7.8% to stop
Reference levels for educational study only. Not a recommendation to buy or sell.
Swing Edge Intelligence
Structured setup analysis · research only
Setup status · Weak structure
Trend, relative strength and distribution characteristics suggest limited breakout quality.
Bullish factors
- Moderate distance from 52w high (-22% below).
- Relative strength remains below leadership thresholds.
- 1 prior pivot rejection in last 60d (-8 pts).
- MACD positive and rising — confirmation only (no bonus).
- Pivot type: sloppy — lower follow-through expected.
- RSI 62 — ideal setup zone.
- Price has built a constructive advance from the 52-week low.
- Distribution pressure visible across recent sessions.
- Pocket pivot detected, but broader structure still shows distribution pressure.
- Price has firmed while volume flow weakens — a cautionary divergence.
- Recent volume expansion — institutional participation may be returning.
Risk factors
- 8 distribution days recently — institutional selling
- Elevated failure risk (66/100)
Why not 100?
- RS rank is below elite leadership band (<90)
- Volume quality is not in top confirmation range yet
Overall view
Localized accumulation signals (such as a pocket pivot) are present, but broader volume flow still reflects distribution pressure. Overall setup quality remains limited despite any localized compression or accumulation cues.
Trade management framework
Research framework only. Use your own risk controls.
- If price moves +1R, consider reducing downside by moving stop closer to entry.
- If price reaches around +1.5R to +2R, consider partial profit booking (for example 20-30%).
- If trend extends beyond +2R, consider trailing below a fast trend reference (for example 21 EMA).
Setup research
SANATHAN — trend, RS & risk snapshot (not a trade recommendation)
Signal · context · invalidation · risk · skip reasons — research only
Why now
Building toward the pivot (8% below)
- Confirmed Stage 2 uptrend
Context & regime
- Market regime Mixed / range-bound
- Trend stage Stage 2 — tradable
- Sector Leading (#7/30) — tailwind
- Relative strength Lagging (RS 50)
- Trend strength Weak (ADX 14)
What invalidates it
This idea is wrong below ₹444.7 (-1.2% away)
Base / stop support breaks — the swing thesis is wrong below here
- Stop / base low₹444.7
- Pivot — failure re-entry below₹480.0
Risk distance
Risk ≈ ₹37.69/share from entry ₹482.4.
Reasons to skip 2
Disqualifiers that apply even if the score looks good.
- 8 distribution days recently — institutional selling
- Elevated failure risk (66/100)
SANATHAN Support & Resistance Levels
Research chart
Daily price action with entry, stop, and target levels from our latest scan, plus relative strength vs Nifty.
Entry zone, stop and targets are drawn on the price chart. · Research only.
Sector RS rank · latest scan
Loading peer comparison…
Trader brief
What to understand
SANATHAN Entry, Stop-Loss & Targets
Research heuristic · not a buy/sell call
Low scanner score suggests weak or incomplete structure. Use this page for context, not as a primary trade candidate until the score and trend improve.
AI insights
AI Insights
Generated with AIThese insights are AI-generated to support your research process and should not be treated as investment advice or a recommendation to buy or sell securities.
Sign in to unlock AI Insights
Personalised swing trade analysis powered by Gemini AI
Pattern context 52w · setup · flow
52-week range
—Stage-2 ideal band · Early recovery
Setup highlights
Pattern signals from the latest scan
Smart money flow
Last 60 sessions · accumulation vs distribution
Setup intelligence Overhead · VCP · radar · risk
Overhead supply
Resistance ceiling above current price
Chase / failure risk
Honest read on exhaustion & extended moves
Base / VCP coil
Depth, contractions & pivot distance
Setup quality radar
Shape of the setup in one view
Setup metrics Weak
SANATHAN Technical Analysis & Swing Setup
Grouped structure, momentum and risk from the latest research scan.
Structure
Momentum
Risk
More scanner fields
Peer comparison Sector peers
Sector Peer Comparison
Loading sector peers…
SANATHAN FAQ Common swing-trading questions
Frequently asked questions about SANATHAN
Is SANATHAN a good swing trade right now?
On Swing Edge's swing-setup framework, Sanathan Textiles Ltd. (SANATHAN) currently grades C — mixed — needs patience. Building toward the pivot (8% below). Flagged today. This is educational research, not investment advice.
What are SANATHAN's support and resistance levels?
For SANATHAN, near-term support sits around ₹444.7 (the base/stop zone); overhead resistance is around ₹480.0 (the breakout pivot); the next resistance above is ₹576.0. This is educational research, not investment advice.
What is the breakout / pivot level for SANATHAN?
The breakout pivot for SANATHAN is around ₹480.0. Price is about 8.4% below the pivot and still building toward it. A breakout is typically confirmed on a close above the pivot with above-average volume. This is educational research, not investment advice.
Is SANATHAN above its 50-day and 200-day moving averages?
Yes — SANATHAN is in a confirmed Stage 2 uptrend, trading above its rising 50- and 200-day moving averages, the zone where swing setups tend to work best. This is educational research, not investment advice.
How strong is SANATHAN versus the market (RS rank)?
SANATHAN has a relative strength (RS) rank of 50 out of 100 versus the NSE universe, making it lagging the broader market on relative strength. Trend strength (ADX) reads 14, indicating a weak/choppy trend. This is educational research, not investment advice.
What are the entry, stop-loss and target levels for SANATHAN?
Reference swing levels for SANATHAN: entry around ₹482.4, stop-loss around ₹444.7, targets at ₹576.0 and ₹637.1. That works out to roughly a 2.5:1 reward-to-risk on the first target. These are reference levels for study only — this is educational research, not investment advice.
Answers are generated from Swing Edge's latest scan data and are for research only — not investment advice.
Prices and day-change figures use the last daily close from scan data dated 2026-06-19 — not live intraday NSE quotes.