ETF
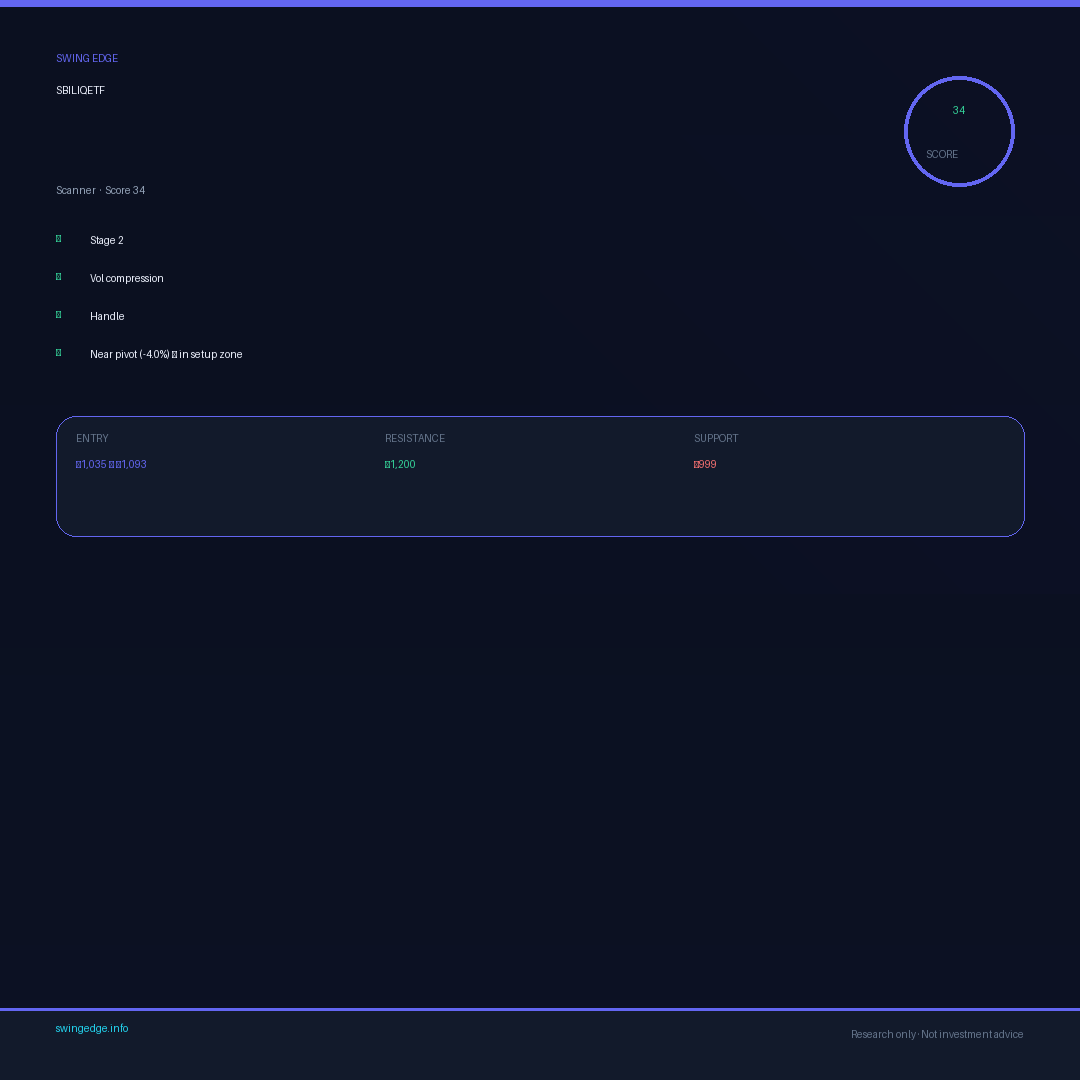
SBILIQETF
Sbi Nifty 1D Rate Liquid ETF
Wait and Watch
Setup readiness
Early Trend
- Entry Zone
- ₹1034.8-1092.5
- Support Level
- ₹999.1
- Resistance
- ₹1199.6
- Risk / Reward
- 1.2 : 1
- Risk Distance
- 8.5% to stop
Reference levels for educational study only. Not a recommendation to buy or sell.
Swing Edge Intelligence
Structured setup analysis · research only
Setup status · Developing setup
Some constructive elements are present, but leadership and breakout quality remain mixed.
Bullish factors
- Price remains very close to the 52-week low — recovery risk is elevated.
- MACD below zero — weak trend (−2).
- Relative strength remains below leadership thresholds.
- Price is approaching the pivot zone.
- 1 prior pivot rejection in last 60d (-8 pts).
- 5 closes within 0.1% — extraordinary tightness, last coil.
- BB squeeze — energy building.
- Pivot type: sloppy — lower follow-through expected.
- Price compression 0.21x — range contracted to 40% of normal.
- Distribution pressure visible across recent sessions.
- OBV divergence — price flat, volume rising: hidden strength.
- Volume at 26% of 50d avg — extreme supply exhaustion, spring loaded.
- Volume flow suggests quiet institutional accumulation.
Risk factors
- Stop is 9% away — too wide to size well for a swing
- Price up but OBV diverging — demand weakening
- RSI 100 — overheated, prone to a shakeout
Why not 100?
- RS rank is below elite leadership band (<90)
- Volume quality is not in top confirmation range yet
- Contraction structure is still shallow for a classic VCP profile
Overall view
Broader structure continues to reflect distribution rather than sustained demand. Short-term compression is improving, though broader structure still warrants patience before breakout confirmation.
Trade management framework
Research framework only. Use your own risk controls.
- If price moves +1R, consider reducing downside by moving stop closer to entry.
- If price reaches around +1.5R to +2R, consider partial profit booking (for example 20-30%).
- If trend extends beyond +2R, consider trailing below a fast trend reference (for example 21 EMA).
Setup research
SBILIQETF — trend, RS & risk snapshot (not a trade recommendation)
Signal · context · invalidation · risk · skip reasons — research only
Why now
Coiled at the pivot — breakout trigger is imminent
- Volume drying up into the base — supply fading
- Handle formed after the prior advance
- Confirmed Stage 2 uptrend
Context & regime
- Market regime Mixed / range-bound
- Trend stage Stage 2 — tradable
- Sector Lagging (#29/30) — headwind
- Relative strength Lagging (RS 49)
- Trend strength Strong (ADX 88)
What invalidates it
This idea is wrong below ₹999.1 (4.3% away)
Base / stop support breaks — the swing thesis is wrong below here
- Stop / base low₹999.1
- Pivot — failure re-entry below₹1087.1
Risk distance
Risk ≈ ₹93.4/share from entry ₹1092.5.
Stop is wide (8%) for a swing — sizing will be small
Reasons to skip 3
Disqualifiers that apply even if the score looks good.
- Stop is 9% away — too wide to size well for a swing
- Price up but OBV diverging — demand weakening
- RSI 100 — overheated, prone to a shakeout
SBILIQETF Support & Resistance Levels
Research chart
Daily price action with entry, stop, and target levels from our latest scan, plus relative strength vs Nifty.
Entry zone, stop and targets are drawn on the price chart. · Research only.
Sector RS rank · latest scan
Loading peer comparison…
Trader brief
What to understand
SBILIQETF Entry, Stop-Loss & Targets
Research heuristic · not a buy/sell call
Low scanner score suggests weak or incomplete structure. Use this page for context, not as a primary trade candidate until the score and trend improve.
AI insights
AI Insights
Generated with AIThese insights are AI-generated to support your research process and should not be treated as investment advice or a recommendation to buy or sell securities.
Sign in to unlock AI Insights
Personalised swing trade analysis powered by Gemini AI
Pattern context 52w · setup · flow
52-week range
—Stage-2 ideal band · Early recovery
Setup highlights
Pattern signals from the latest scan
Smart money flow
Last 60 sessions · accumulation vs distribution
Setup intelligence Overhead · VCP · radar · risk
Overhead supply
Resistance ceiling above current price
Chase / failure risk
Honest read on exhaustion & extended moves
Base / VCP coil
Depth, contractions & pivot distance
Setup quality radar
Shape of the setup in one view
Setup metrics Weak
SBILIQETF Technical Analysis & Swing Setup
Grouped structure, momentum and risk from the latest research scan.
Structure
Momentum
Risk
More scanner fields
Peer comparison Sector peers
Sector Peer Comparison
Loading sector peers…
SBILIQETF FAQ Common swing-trading questions
Frequently asked questions about SBILIQETF
Is SBILIQETF a good swing trade right now?
On Swing Edge's swing-setup framework, Sbi Nifty 1D Rate Liquid ETF (SBILIQETF) currently grades C — mixed — needs patience. Coiled at the pivot — breakout trigger is imminent. Flagged today. This is educational research, not investment advice.
What are SBILIQETF's support and resistance levels?
For SBILIQETF, near-term support sits around ₹999.1 (the base/stop zone); overhead resistance is around ₹1,087.1 (the breakout pivot); the next resistance above is ₹1,199.6. This is educational research, not investment advice.
What is the breakout / pivot level for SBILIQETF?
The breakout pivot for SBILIQETF is around ₹1,087.1. Price is about 4.0% below the pivot and still building toward it. A breakout is typically confirmed on a close above the pivot with above-average volume. This is educational research, not investment advice.
Is SBILIQETF above its 50-day and 200-day moving averages?
Yes — SBILIQETF is in a confirmed Stage 2 uptrend, trading above its rising 50- and 200-day moving averages, the zone where swing setups tend to work best. This is educational research, not investment advice.
How strong is SBILIQETF versus the market (RS rank)?
SBILIQETF has a relative strength (RS) rank of 49 out of 100 versus the NSE universe, making it lagging the broader market on relative strength. Trend strength (ADX) reads 88, indicating a strong trend. This is educational research, not investment advice.
What are the entry, stop-loss and target levels for SBILIQETF?
Reference swing levels for SBILIQETF: entry around ₹1,092.5, stop-loss around ₹999.1, targets at ₹1,199.6 and ₹1,289.6. That works out to roughly a 1.2:1 reward-to-risk on the first target. These are reference levels for study only — this is educational research, not investment advice.
Answers are generated from Swing Edge's latest scan data and are for research only — not investment advice.
Prices and day-change figures use the last daily close from scan data dated 2026-06-19 — not live intraday NSE quotes.