Refineries
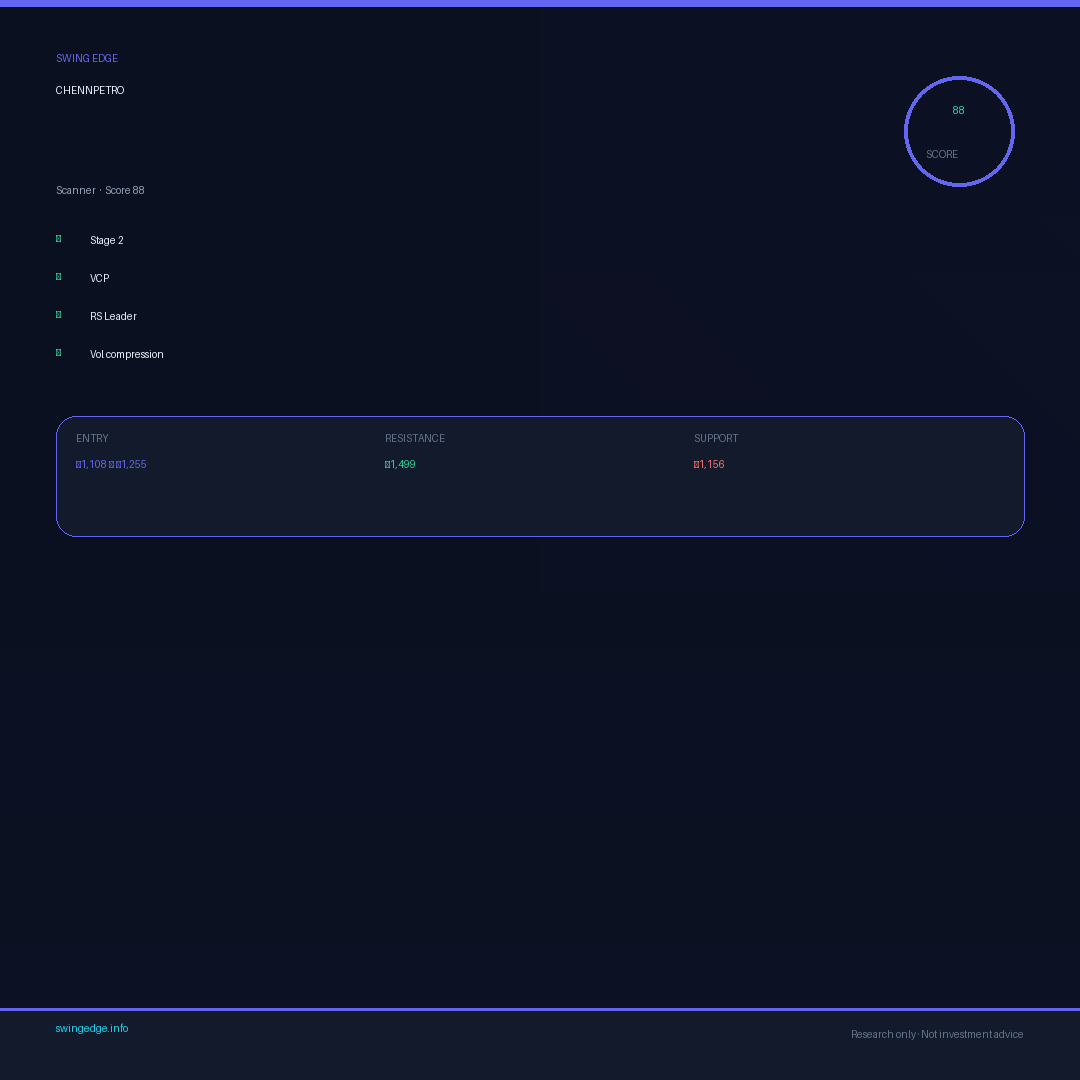
CHENNPETRO
Chennai Petroleum Corporation Ltd.
Strong momentum structure
Setup readiness
Early Trend
- Pivot Levels
- ₹1108.4-1255.2
- Support Level
- ₹1156.3
- Resistance
- ₹1498.8
- Risk Distance
- 7.9% to stop
Reference levels for educational study only. Not a recommendation to buy or sell.
Swing Edge Intelligence
Structured setup analysis · research only
Setup status · Strong leadership structure
Trend, relative strength and setup quality align with leading momentum names.
Bullish factors
- MACD below zero — weak trend (−2).
- OBV leadership while price lags — accumulation divergence.
- 1 prior pivot rejection in last 60d (-8 pts).
- ATR 4.5%/day — healthy volatility (+4).
- BB squeeze — energy building.
- Pivot type: flat-top — premium structure.
- RSI 48 — ideal setup zone.
- Volume flow suggests quiet institutional accumulation.
Risk factors
Overall view
Leadership metrics are generally constructive, but select risk factors below deserve attention.
Setup research
CHENNPETRO — trend, RS & risk snapshot (not a trade recommendation)
Signal · context · invalidation · risk · skip reasons — research only
Positives
Building toward the pivot (12% below)
- Volume drying up into the base — supply fading
- Confirmed Stage 2 uptrend
Context & regime
- Market regime Mixed / range-bound
- Trend stage Stage 2 — tradable
- Sector RS Lagging group
- Relative strength Building (RS 78)
- Trend strength Weak (ADX 17)
Negatives
This idea is wrong below ₹1156.3 (-4.9% away)
Base / stop support breaks — the swing thesis is wrong below here
- Stop / base low₹1156.3
- Pivot — failure re-entry below₹1249.0
Risk distance
Risk ≈ ₹98.89/share from entry ₹1255.2.
No major skip flags detected from current scanner data.
Setup metrics Latest scan
CHENNPETRO Technical Analysis & Swing Setup
Grouped structure, momentum and risk from the latest research scan.
Structure
Momentum
Risk
More scanner fields
CHENNPETRO Support & Resistance Levels
Research chart
Daily price action with pivot, support, and resistance levels from our latest scan, plus relative strength vs Nifty.
Pivot levels, support and resistance are drawn on the price chart. · Research only.
Sector RS rank · latest scan
Loading peer comparison…
Seasonality — monthly returns
How this stock moved month by month over the last ~2 years.
A rough tendency, not a reliable pattern. Research only, not advice.
AI insights
AI Insights
Generated with AIThese insights are AI-generated to support your research process and should not be treated as investment advice or a recommendation to buy or sell securities.
Sign in to unlock AI Insights
Personalised swing trade analysis powered by Gemini AI
Pattern context 52w · setup · flow
52-week range
—Stage-2 ideal band · Early recovery
Pattern highlights
Pattern signals from the latest scan
Smart money flow
Last 60 sessions · accumulation vs distribution
Setup intelligence Overhead · VCP · radar · risk
Overhead supply
Resistance ceiling above current price
Chase / failure risk
Honest read on exhaustion & extended moves
Base / VCP coil
Depth, contractions & pivot distance
Setup quality radar
Shape of the setup in one view
Peer comparison Sector peers
Sector Peer Comparison
Loading sector peers…
CHENNPETRO FAQ Common swing-trading questions
Frequently asked questions about CHENNPETRO
What are the screener observations for CHENNPETRO?
On Swing Edge's swing-setup framework, Chennai Petroleum Corporation Ltd. (CHENNPETRO) currently grades B — workable setup. Building toward the pivot (12% below). Flagged today. This is educational research, not investment advice.
What are CHENNPETRO's support and resistance levels?
For CHENNPETRO, near-term support sits around ₹1,156.3 (the base/stop zone); overhead resistance is around ₹1,249.0 (the breakout pivot); the next resistance above is ₹1,498.8. This is educational research, not investment advice.
What is the breakout / pivot level for CHENNPETRO?
The breakout pivot for CHENNPETRO is around ₹1,249.0. Price is about 11.8% below the pivot and still building toward it. A breakout is typically confirmed on a close above the pivot with above-average volume. This is educational research, not investment advice.
Is CHENNPETRO above its 50-day and 200-day moving averages?
Yes — CHENNPETRO is in a confirmed Stage 2 uptrend, trading above its rising 50- and 200-day moving averages, the zone where swing setups tend to work best. This is educational research, not investment advice.
How strong is CHENNPETRO versus the market (RS rank)?
CHENNPETRO has a relative strength (RS) rank of 78 out of 100 versus the NSE universe, making it building relative strength and outperforming the broader market. Trend strength (ADX) reads 17, indicating a weak/choppy trend. This is educational research, not investment advice.
Answers are generated from Swing Edge's latest scan data and are for research only — not investment advice.
Prices and day-change figures use the last daily close from scan data dated 2026-06-25 — not live intraday NSE quotes.