
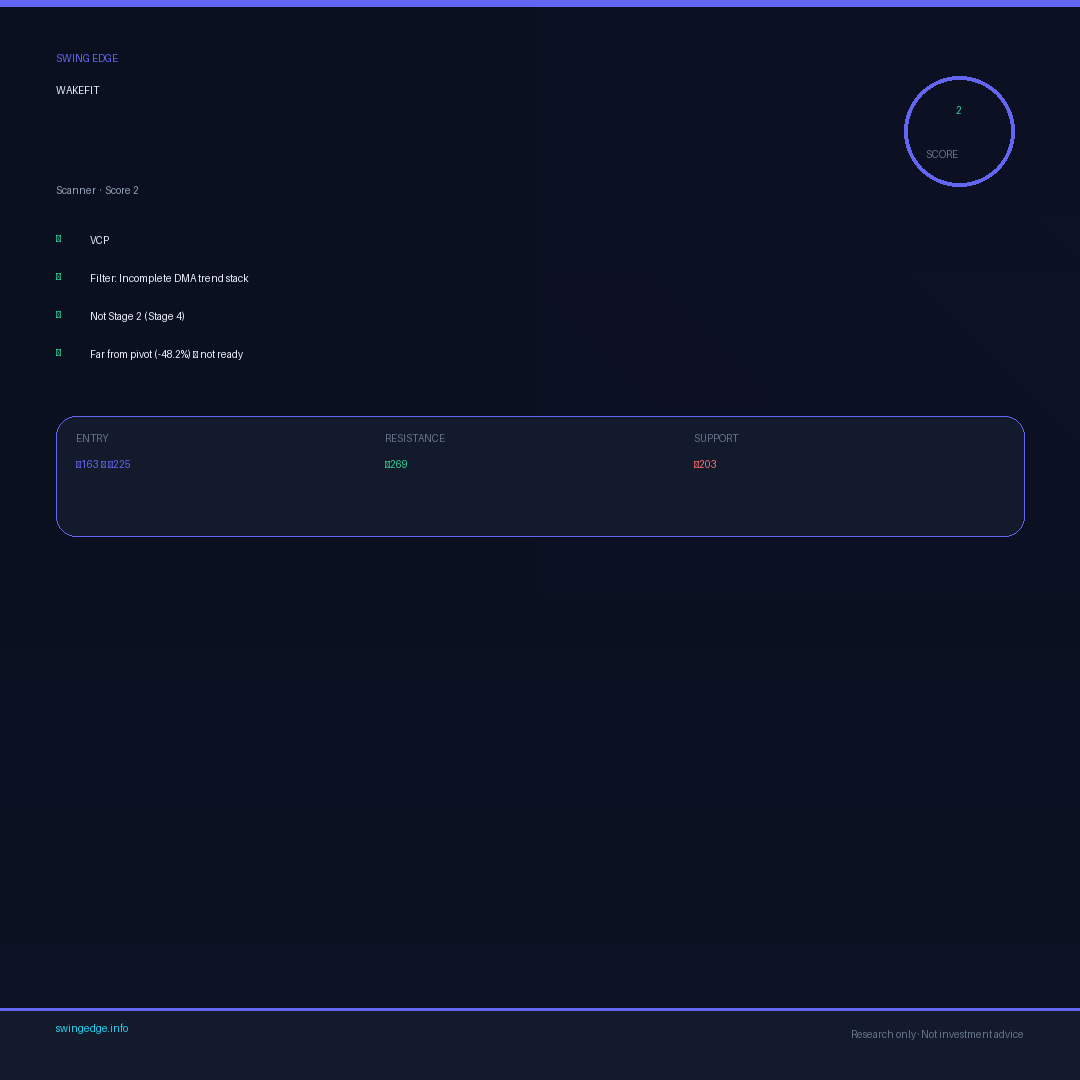
WAKEFIT
Wakefit Innovations Ltd.
Household & Personal Products
Setup readiness
Early Trend
- Pivot Levels
- ₹143.2-173.9
- Support Level
- ₹163.4
- Resistance
- ₹207.6
- Risk Distance
- 6.0% to stop
Pivot, entry, support, and resistance levels are generated automatically by our research algorithms from historical market data. They may be incomplete or inaccurate and can change between scans. Shown for research and educational study only — not investment advice or a recommendation to buy, sell, or hold any security. Do not base trading decisions on these levels.
Swing Edge Intelligence
Structured setup analysis · research only
Setup status · Mixed technical setup
Stage 1 trend context — relative strength and breakout quality remain primary constraints.
Bullish factors
- Price remains distant from the pivot zone.
- Price remains materially below prior highs.
- Relative strength remains low versus the broader market.
- Trend stage reads as Stage 1.
- Incomplete DMA trend stack.
- 3 closes within 0.3% — extraordinary tightness, last coil.
- ATR 4.0%/day — healthy volatility (+4).
- MACD bearish divergence — price firm but histogram fading (−4).
- RSI 55 — ideal setup zone.
- VCP-style base with 7 contraction(s) detected.
- Distribution pressure observed in recent sessions.
- Pocket pivot detected, but broader structure still shows distribution pressure.
- 73% of profile volume above POC.
- OBV divergence — price flat, volume rising: hidden strength.
Risk factors
- Price advancing while OBV shows divergence
- Significant overhead supply (67%)
- Stage reads as Stage 1 (not Stage 2)
Overall view
Localized accumulation signals (such as pocket pivot) are present, but broader volume flow shows distribution pressure. The setup is still developing with mixed momentum and trend alignment.
Swing Edge Indicator (SEI) Edge Fading · Grade D
How favorable this setup looks for swing trading, from the latest research scan. For research only — not trade advice.
- Phase
- NEUTRAL
- Grade
- D
- Setup window
- 20 of 20
- Edge label
- Edge Fading
Market structure BOS · FVG · OB · sweeps
Daily-bar structure only. Research context — not trade signals.
Structure & BOS
Swing trend and break of structure on daily bars
Premium / discount
Price position vs 20-day equilibrium
Fair value gaps
Unfilled daily imbalance zones
Order blocks
Displacement zones after strong moves
Liquidity sweeps
Recent stop-run events on daily bars
Breaker levels
Prior swing levels cleared on latest close
Setup research
WAKEFIT — trend, RS & risk snapshot (not a trade recommendation)
Signal · context · invalidation · risk · skip reasons — research only
Positives
Price is 25% below the pivot
- Volume at 2.1× the 50-day average
Context & regime
- Market regime Mixed / range-bound
- Trend stage Stage 1
- Sector RS Lagging group
- Relative strength Lagging (RS 8)
- Trend strength Weak (ADX 20)
Negatives
This idea is wrong below ₹163.4 (-25.6% away)
Base / stop support breaks — the swing thesis is wrong below here
- Stop / base low₹163.4
- Pivot — failure re-entry below₹173.0
Risk distance
Risk ≈ ₹10.42/share from entry ₹173.9.
Reasons to skip 3
Disqualifiers that apply even if the score looks good.
- Price advancing while OBV shows divergence
- Significant overhead supply (67%)
- Stage reads as Stage 1 (not Stage 2)
Setup metrics Latest scan
WAKEFIT Technical Analysis & Swing Setup
Grouped structure, momentum and risk from the latest research scan.
Volume Profile bullish
- POC
- ₹124.75
- VAH
- ₹143.9
- VAL
- ₹113.14
- Vol above POC
- 72.7%
Institutional Activity · Moderate Accumulation
- Avg cost basis
- ₹138.81
- Acc zone
- ₹119.5–143.6
- Accumulation sessions
- 3
- CMF
- 0.08
Structure
Momentum
Risk
More scanner fields
WAKEFIT Support & Resistance Levels
Research chart
Daily price action with pivot, support, and resistance levels from our latest scan, plus relative strength vs Nifty.
Sector RS rank · latest scan
Loading peer comparison…
Pivot levels, support and resistance are drawn on the price chart.
Algorithm-generated levels from historical data. For research and education only — may not be accurate; not investment advice.
Seasonality — monthly returns
How this stock moved month by month over the last ~2 years.
A rough tendency, not a reliable pattern. Research only, not advice.
AI insights
AI Insights
Generated with AIThese insights are AI-generated to support your research process and should not be treated as investment advice or a recommendation to buy or sell securities.
Sign in to unlock AI Insights
Personalised swing trade analysis powered by Gemini AI
Pattern context 52w · setup · flow
52-week range
—Stage-2 ideal band · Early recovery
Pattern highlights
Pattern signals from the latest scan
Smart money flow
Last 60 sessions · accumulation vs distribution
Setup intelligence Overhead · VCP · radar · risk
Overhead supply
Resistance ceiling above current price
Chase / failure risk
Honest read on exhaustion & extended moves
Base / VCP coil
Depth, contractions & pivot distance
Setup quality radar
Shape of the setup in one view
Peer comparison Sector peers
Sector Peer Comparison
Loading sector peers…
WAKEFIT FAQ Common swing-trading questions
Frequently asked questions about WAKEFIT
What are the screener observations for WAKEFIT?
On Swing Edge's swing-setup framework, Wakefit Innovations Ltd. (WAKEFIT) currently grades D — low-quality — likely skip. Price is 25% below the pivot. Flagged 2 days ago. This is educational research, not investment advice.
What are WAKEFIT's support and resistance levels?
For WAKEFIT, near-term support sits around ₹163.4 (the base/stop zone); overhead resistance is around ₹173.0 (the breakout pivot); the next resistance above is ₹207.6. This is educational research, not investment advice.
What is the breakout / pivot level for WAKEFIT?
The breakout pivot for WAKEFIT is around ₹173.0. Price is about 24.8% below the pivot and still building toward it. A breakout is typically confirmed on a close above the pivot with above-average volume. This is educational research, not investment advice.
Is WAKEFIT above its 50-day and 200-day moving averages?
WAKEFIT is currently in Stage 1, not a confirmed Stage 2 uptrend, so trend support from the key moving averages is weaker than ideal for a swing entry. This is educational research, not investment advice.
How strong is WAKEFIT versus the market (RS rank)?
WAKEFIT has a relative strength (RS) rank of 8 out of 100 versus the NSE universe, making it lagging the broader market on relative strength. Trend strength (ADX) reads 20, indicating a weak/choppy trend. This is educational research, not investment advice.
Answers are generated from Swing Edge's latest scan data and are for research only — not investment advice.
Recently viewed
Prices and day-change figures use the last daily close from scan data dated 2026-07-17 — not live intraday NSE quotes.