Momentum Continuation page
Continuation-tagged names from the daily breakout scan — mid-trend pauses after prior strength.
Page screenshot
Numbered markers highlight areas described in the steps below (desktop layout).
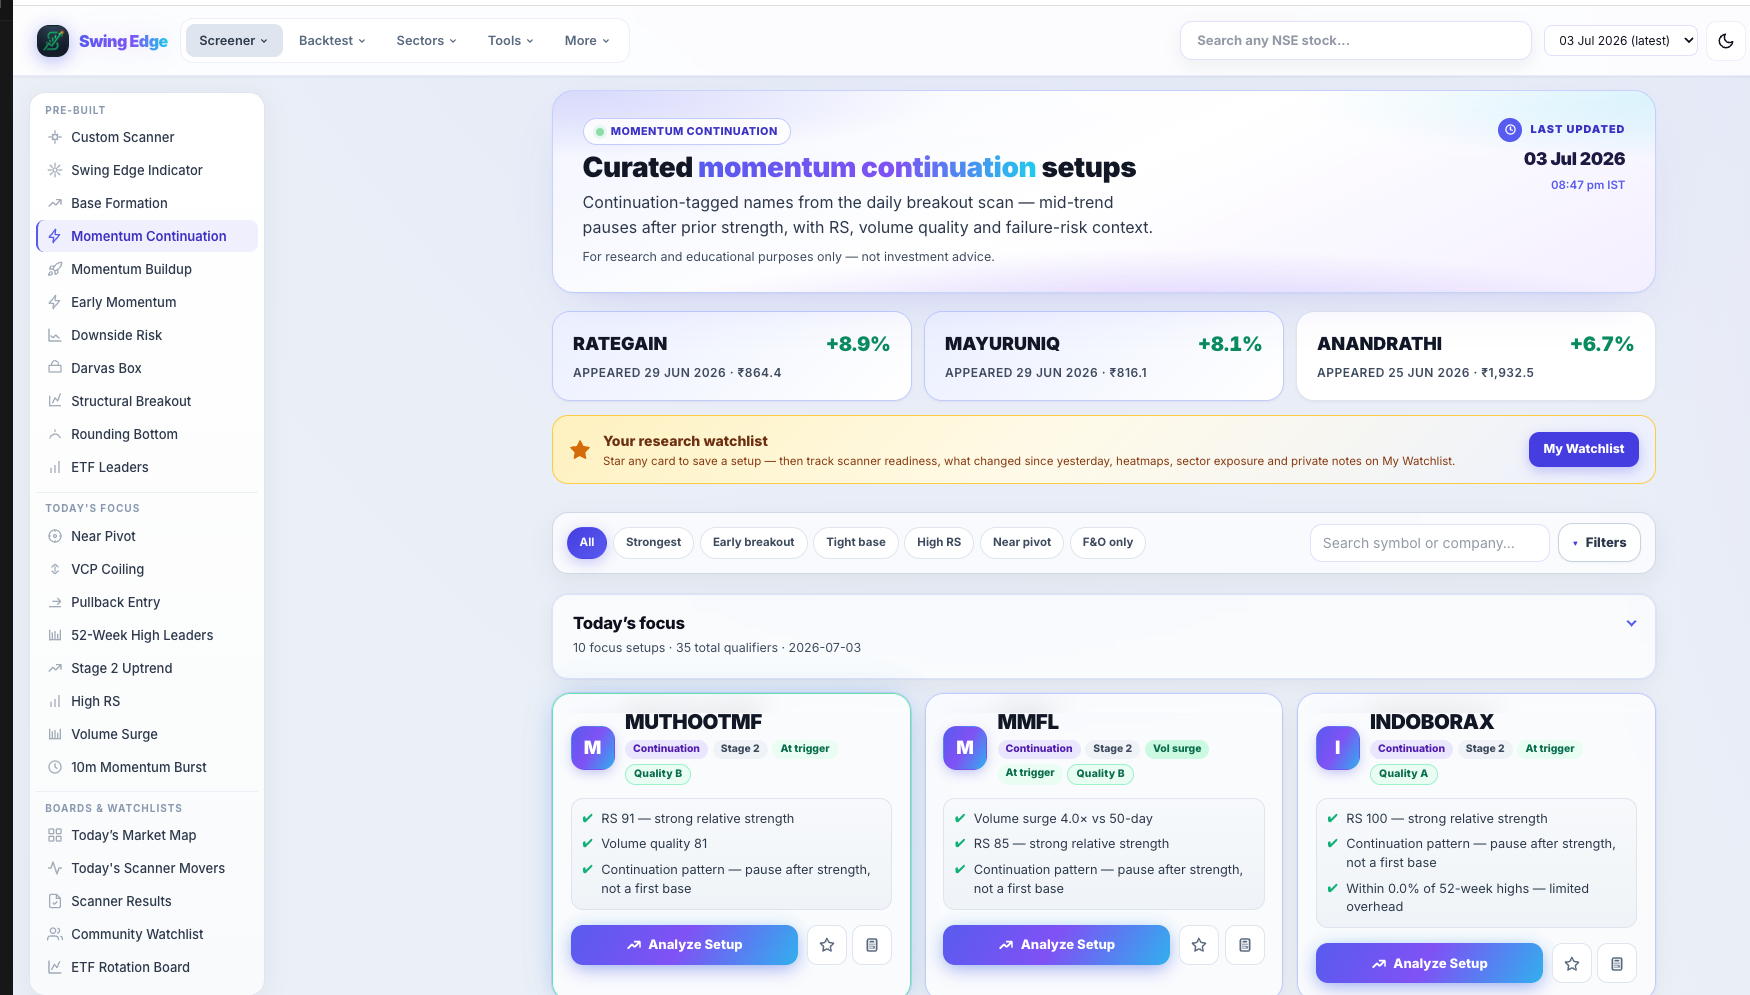
- Active screener (sidebar)
- Page hero & scan date
- Filter & search bar
- Result card
Screenshot coming soon
Add desktop.png under static/tutorials/momentum-continuation/
Step-by-step
-
What this page is
Only rows tagged Continuation from the nightly breakout scan. These are mid-move pauses after earlier strength — structure from price and volume history, not a forecast.
-
Continuation vs Buildup
Momentum Buildup lists HTF, Active Breakout, and Fresh Turnaround — earlier or first-clear structures. This page is fixed to Continuation only. Same scan engine, different pattern bucket.
-
Score gate
Saved rows typically need total score ≥ 70 to appear in the curated list, same as other primary scanners.
-
Filter pills
Start with All, then try Strong + Vol Confirmed for higher scores and heavy volume vs the 50-day average. Leading RS keeps names beating the broad index in our RS math.
-
Volume confirmation
Vol Q and Vol ×50d on the card show how the model graded participation on the signal day. Low-volume clears are scored down in the rules.
-
From pivot & extension
From pivot and distance-from-52w-high columns show how extended price is. Context only — not a “too late” call from us.
-
Next steps
Open the stock page for SEI, metrics, and chart markers. Cross-check Downside Risk if you track distribution on names you hold.
Detailed reference
Continuation tag
Marks a mid-trend pause after a prior advance — price holding above key averages with constructive volume in the model. Different from a first break (Active BO) or pole-and-flag (HTF).
Fields on each card
- Total score (0–100) — weighted mix of base quality, RS, volume participation, and failure-risk flags.
- Signal — short label from the score band (Very Strong down to Weak). Describes the row, not an action.
- RS rank — percentile vs other names in the same nightly scan (higher = stronger relative performance).
- Vol Q — volume quality tag (dry-up in a base, surge on a break, low participation on a clear, etc.).
- From pivot — distance (%) from the scan’s pivot level; extension context only.
- Fail risk — flag when structure looks extended, late, or prone to false breaks in the model.
- Vol ×50d — how the signal-day volume compared to the 50-day average on breakout-style scans.
Filter pills
Pills like All, Strongest, F&O, Vol Confirmed, and Leading RS only hide rows on your screen. They do not re-run the scan or change saved data.
Open in the app
FAQ
What does the Momentum Continuation tutorial cover?
Continuation-tagged names from the daily breakout scan — mid-trend pauses after prior strength.
Is the Momentum Continuation tutorial investment advice?
No. Swing Edge tutorials explain scan data and app features for your own research. They do not recommend buying, selling, or holding any security.
How do I get started with Momentum Continuation on Swing Edge?
What this page is: Only rows tagged Continuation from the nightly breakout scan. These are mid-move pauses after earlier strength — structure from price and volume history, not a forecast.