Indicator Edge Explorer
Slice historical backtests by RS, volume, base quality, and other bins.
Page screenshot
Numbered markers highlight areas described in the steps below (desktop layout).
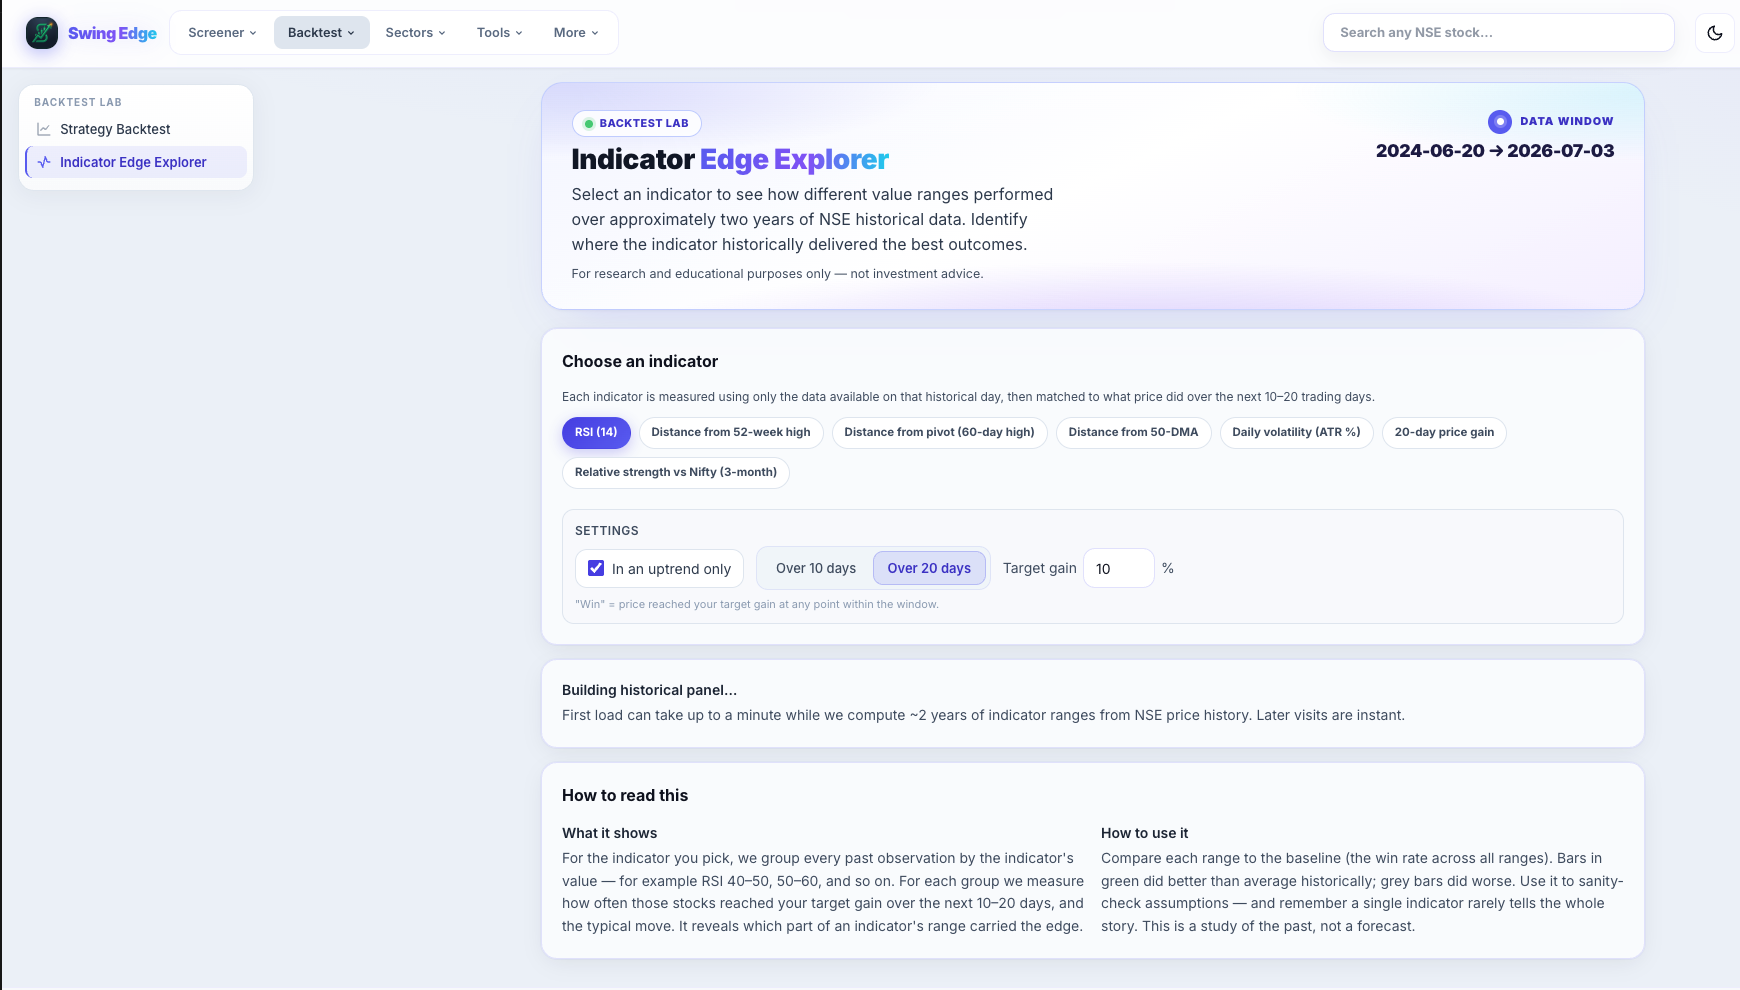
- Indicator Edge Explorer
- Data window
- Choose indicator
- Target gain & settings
- How to read this
Screenshot coming soon
Add desktop.png under static/tutorials/indicator-edge/
Step-by-step
-
Purpose
After running backtests, see which indicator cut-offs correlated with better or worse forward returns in our stored history — hypothesis testing, not live signals.
-
Slices
Split outcomes by RS rank bins, volume ratio tiers, Base Q bands, stage, Fail risk flags, and similar dimensions.
-
Charts
Bar or line views of hit rate and average return per bin. Compare bins side by side.
-
Reading edge
A higher bar in one bin means that sub-group performed better in past data — verify sample size before trusting it.
-
Combine with Backtest Lab
Run a base backtest first, then open Indicator Edge to drill into which fields mattered historically.
-
Not optimized for you
Bins are fixed in the product — not personalized ML. Use for rough rule research.
-
Caution
Data mining bias is real. Out-of-sample testing and your own chart work still required.
Detailed reference
Bin
A range bucket for a numeric field — e.g. RS 70–80 vs RS 80–90 — used to compare average forward returns.
Open in the app
FAQ
What does the Indicator Edge Explorer tutorial cover?
Slice historical backtests by RS, volume, base quality, and other bins.
Is the Indicator Edge Explorer tutorial investment advice?
No. Swing Edge tutorials explain scan data and app features for your own research. They do not recommend buying, selling, or holding any security.
How do I get started with Indicator Edge Explorer on Swing Edge?
Purpose: After running backtests, see which indicator cut-offs correlated with better or worse forward returns in our stored history — hypothesis testing, not live signals.