Momentum Buildup page
HTF, Active Breakout, and Fresh Turnaround tags from the daily breakout scan.
Page screenshot
Numbered markers highlight areas described in the steps below (desktop layout).
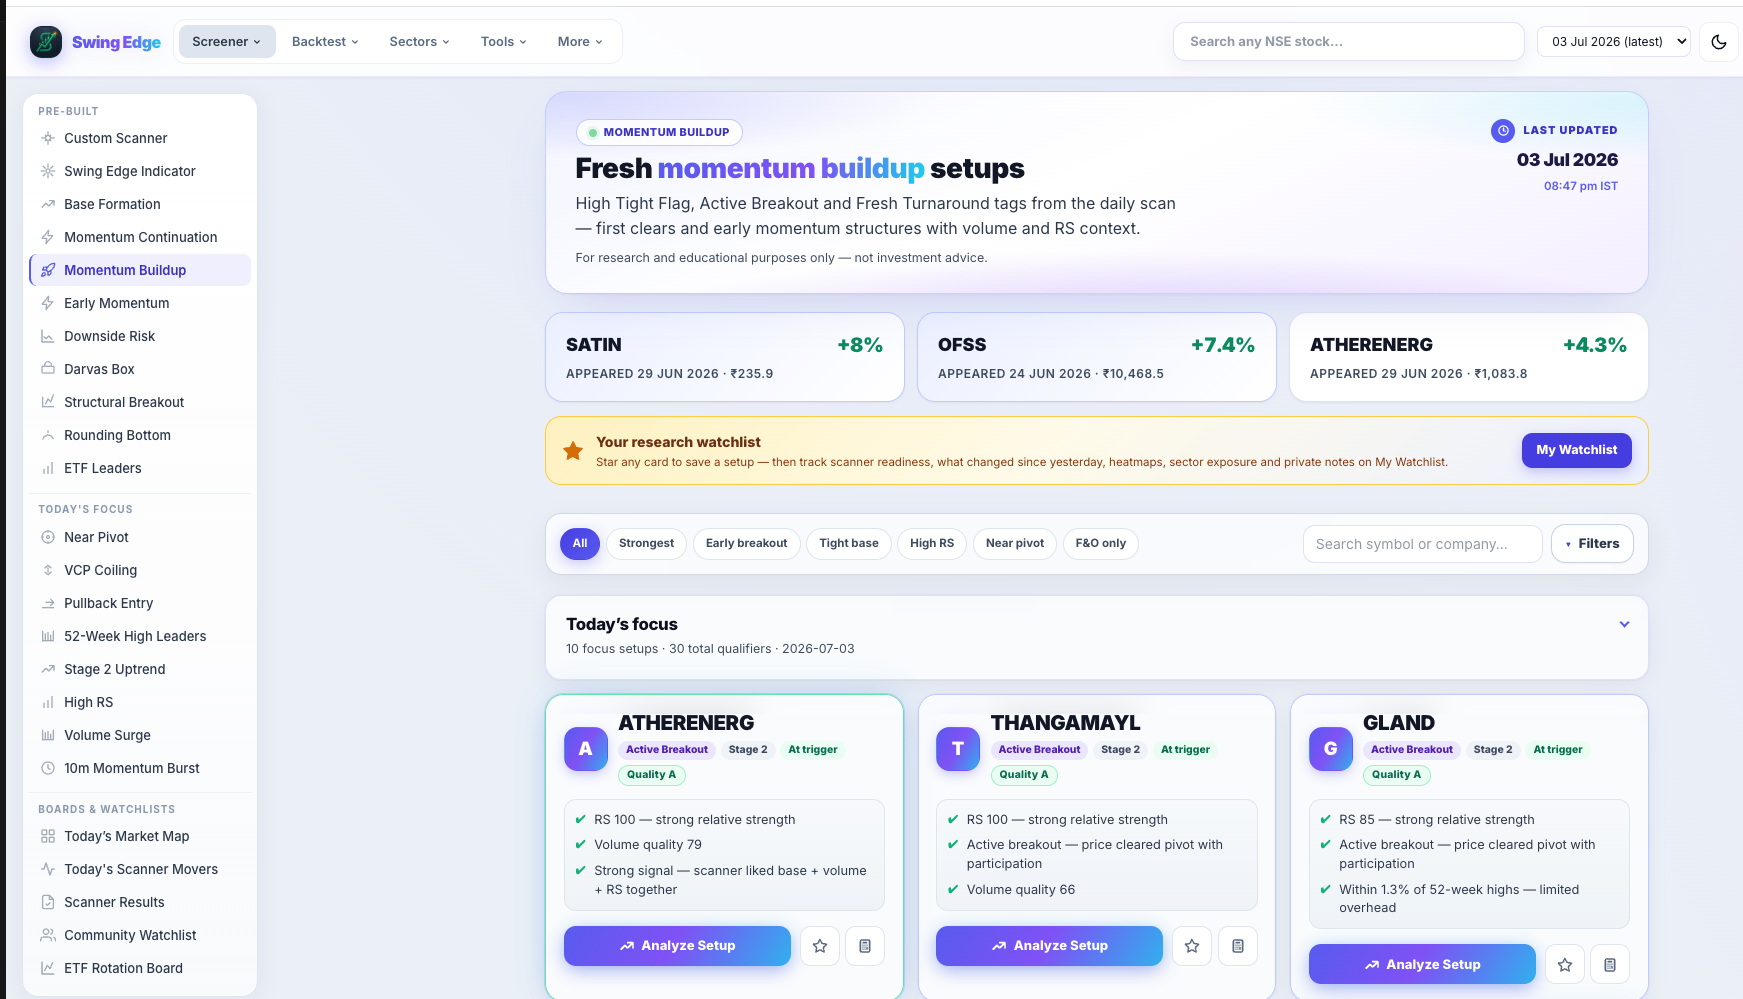
- Active screener (sidebar)
- Page hero & scan date
- Filter & search bar
- Result card
Screenshot coming soon
Add desktop.png under static/tutorials/momentum-buildup/
Step-by-step
-
What this page is
Fresh clears and early momentum structures from the nightly breakout scan — not mid-trend Continuation pauses (those live on Momentum Continuation). Three pattern tags: High Tight Flag, Active Breakout, and Fresh Turnaround Breakout.
-
High Tight Flag (HTF)
Pole-and-flag geometry: a rapid advance (pole) followed by a tight, low-volume flag. The card shows pole/flag stats the model measured.
-
Active Breakout
First clear move out of a multi-week base on strong volume (typically 1.5×+ vs recent averages). Classic Stage 2 launch structure in the scan.
-
Fresh Turnaround Breakout
Early reversal clear after a downtrend or base repair — turnaround momentum with volume checked against the 50-day average.
-
Filter by pattern
Use pattern pills to isolate HTF, Active BO, or Fresh Turnaround. Each bucket describes different structure.
-
Volume & score
Every tagged row carries volume-quality scoring. Check Vol Q, Vol ×50d, total score, and Fail risk on each card.
-
vs Base Formation
Base Formation lists names still below the pivot in base shape. Buildup rows already triggered breakout-style rules.
-
Research workflow
Filter → open card → stock page for full metrics and chart levels. Use Position Sizing separately if you work out size.
Detailed reference
Buildup vs continuation
Buildup = earlier-stage clears (HTF, Active BO, Fresh Turnaround). Continuation = mid-trend pause. Both from one daily breakout pass.
Vol ×50d
Signal-day volume divided by the 50-day average. Higher = heavier participation on the day the model flagged the move.
Fields on each card
- Total score (0–100) — weighted mix of base quality, RS, volume participation, and failure-risk flags.
- Signal — short label from the score band (Very Strong down to Weak). Describes the row, not an action.
- RS rank — percentile vs other names in the same nightly scan (higher = stronger relative performance).
- Vol Q — volume quality tag (dry-up in a base, surge on a break, low participation on a clear, etc.).
- From pivot — distance (%) from the scan’s pivot level; extension context only.
- Fail risk — flag when structure looks extended, late, or prone to false breaks in the model.
- Vol ×50d — how the signal-day volume compared to the 50-day average on breakout-style scans.
Filter pills
Pills like All, Strongest, F&O, Vol Confirmed, and Leading RS only hide rows on your screen. They do not re-run the scan or change saved data.
Open in the app
FAQ
What does the Momentum Buildup tutorial cover?
HTF, Active Breakout, and Fresh Turnaround tags from the daily breakout scan.
Is the Momentum Buildup tutorial investment advice?
No. Swing Edge tutorials explain scan data and app features for your own research. They do not recommend buying, selling, or holding any security.
How do I get started with Momentum Buildup on Swing Edge?
What this page is: Fresh clears and early momentum structures from the nightly breakout scan — not mid-trend Continuation pauses (those live on Momentum Continuation). Three pattern tags: High Tight Flag, Active Breakout, and Fresh Turnaround Breakout.