Downside Risk page
Bearish-structure names from the downside scan — for research and risk context.
Page screenshot
Numbered markers highlight areas described in the steps below (desktop layout).
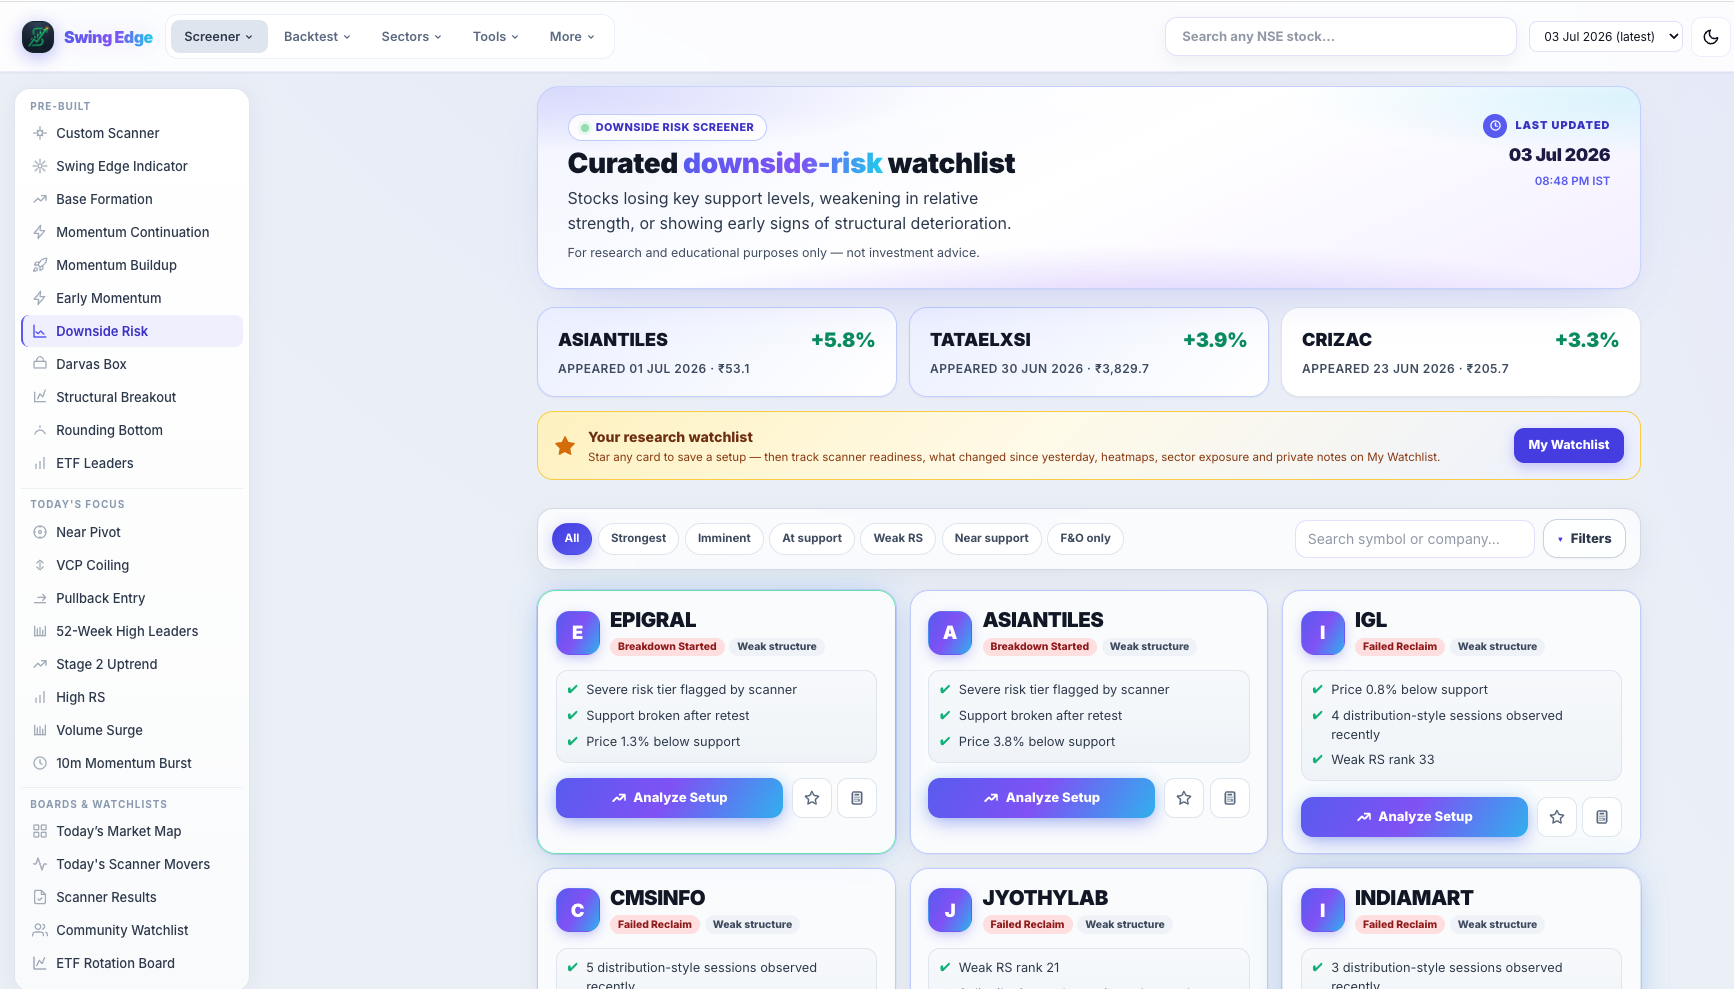
- Active screener (sidebar)
- Page hero & scan date
- Filter & search bar
- Result card
Screenshot coming soon
Add desktop.png under static/tutorials/downside-risk/
Step-by-step
-
Purpose
Symbols that matched downside rules — broken support, distribution, stage deterioration. For hedging research or avoid lists. Not a short-sale recommendation list.
-
Bearish score
Downside score from trend weakness, RS, volume on down days, and pattern flags. Higher = more bearish structure in the model.
-
Risk labels
Severe, Elevated, and Moderate summarize the score band. Read the pattern tag for the specific trigger.
-
Filter pills
All shows the full list. Strongest keeps highest downside scores. F&O limits to derivative-eligible symbols.
-
Not an exit signal
Listing here does not mean you must sell holdings. One bearish filter for your process.
-
Pair with bullish scans
Cross-check names from Base Formation or Momentum Buildup for overlapping bearish flags.
-
Stock page
Open any card for historical appearances, stage, and RS — same layout as bullish scanners.
Detailed reference
Downside vs bullish scans
Breakout scanners tag strength. Downside Risk uses a separate bearish rule set on weak or breaking structure.
Fields on each card
- Total score (0–100) — weighted mix of base quality, RS, volume participation, and failure-risk flags.
- Signal — short label from the score band (Very Strong down to Weak). Describes the row, not an action.
- RS rank — percentile vs other names in the same nightly scan (higher = stronger relative performance).
- Vol Q — volume quality tag (dry-up in a base, surge on a break, low participation on a clear, etc.).
- From pivot — distance (%) from the scan’s pivot level; extension context only.
- Fail risk — flag when structure looks extended, late, or prone to false breaks in the model.
- Vol ×50d — how the signal-day volume compared to the 50-day average on breakout-style scans.
Filter pills
Pills like All, Strongest, F&O, Vol Confirmed, and Leading RS only hide rows on your screen. They do not re-run the scan or change saved data.
Open in the app
FAQ
What does the Downside Risk tutorial cover?
Bearish-structure names from the downside scan — for research and risk context.
Is the Downside Risk tutorial investment advice?
No. Swing Edge tutorials explain scan data and app features for your own research. They do not recommend buying, selling, or holding any security.
How do I get started with Downside Risk on Swing Edge?
Purpose: Symbols that matched downside rules — broken support, distribution, stage deterioration. For hedging research or avoid lists. Not a short-sale recommendation list.