Trade Analyzer tool
Review a past or paper trade — R-multiple, hold time, and scan context.
Page screenshot
Numbered markers highlight areas described in the steps below (desktop layout).
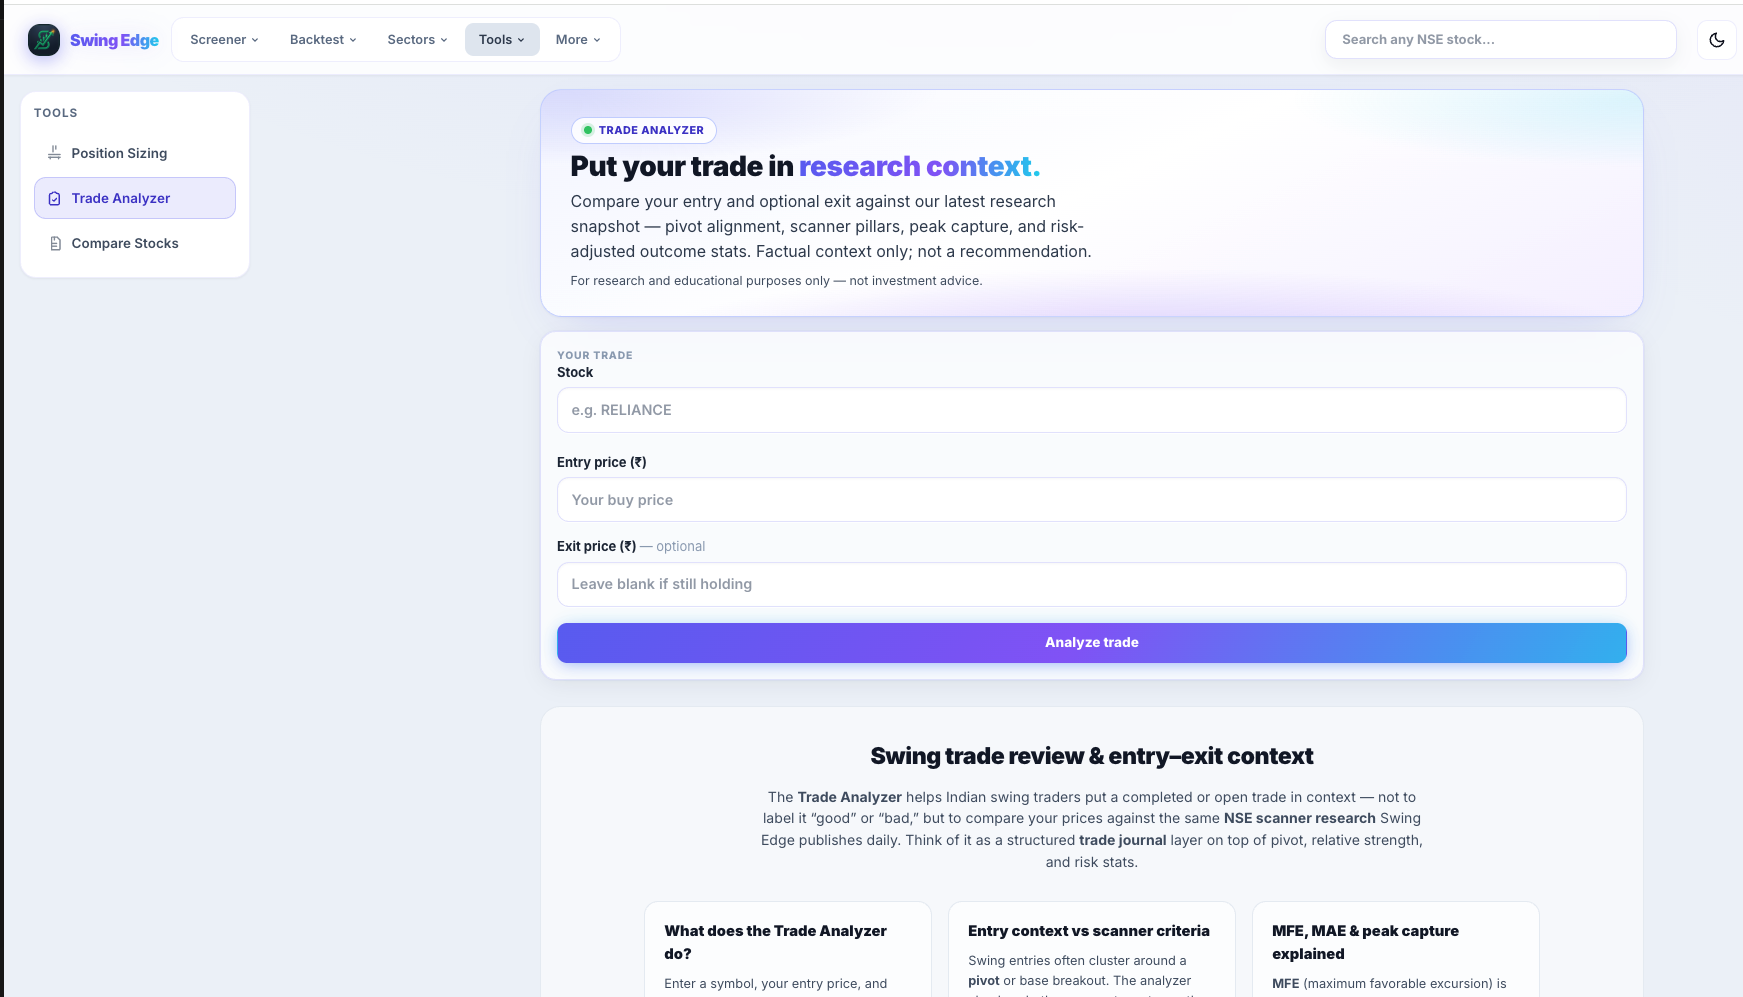
- Trade Analyzer
- Tool description
- Stock symbol
- Entry & exit prices
- Analyze trade
Screenshot coming soon
Add desktop.png under static/tutorials/trade-analyzer/
Step-by-step
-
Purpose
Journaling and review — enter what you actually did (or a paper trade) and see structured stats plus scan context at entry.
-
Required inputs
Symbol, entry price, and either exit price or stop. Optional dates for hold-period calculation.
-
R-multiple output
How many times your initial risk you gained or lost. +2R means profit was 2× the entry-to-stop distance.
-
Hold time
Calendar or session days between entry and exit when dates are provided.
-
Scan context
What Base Formation / breakout scanners showed around entry date — tags, scores, RS — for notes, not grading your decision.
-
OHLC source
Prices from stored history where available. Gaps or corporate actions may affect exact bars.
-
Not live trading
No broker link. Does not place or modify orders.
Detailed reference
R-multiple
(Exit − Entry) ÷ (Entry − Stop) for a long with a defined stop. Standardizes outcomes across different position sizes.
Open in the app
FAQ
What does the Trade Analyzer tutorial cover?
Review a past or paper trade — R-multiple, hold time, and scan context.
Is the Trade Analyzer tutorial investment advice?
No. Swing Edge tutorials explain scan data and app features for your own research. They do not recommend buying, selling, or holding any security.
How do I get started with Trade Analyzer on Swing Edge?
Purpose: Journaling and review — enter what you actually did (or a paper trade) and see structured stats plus scan context at entry.