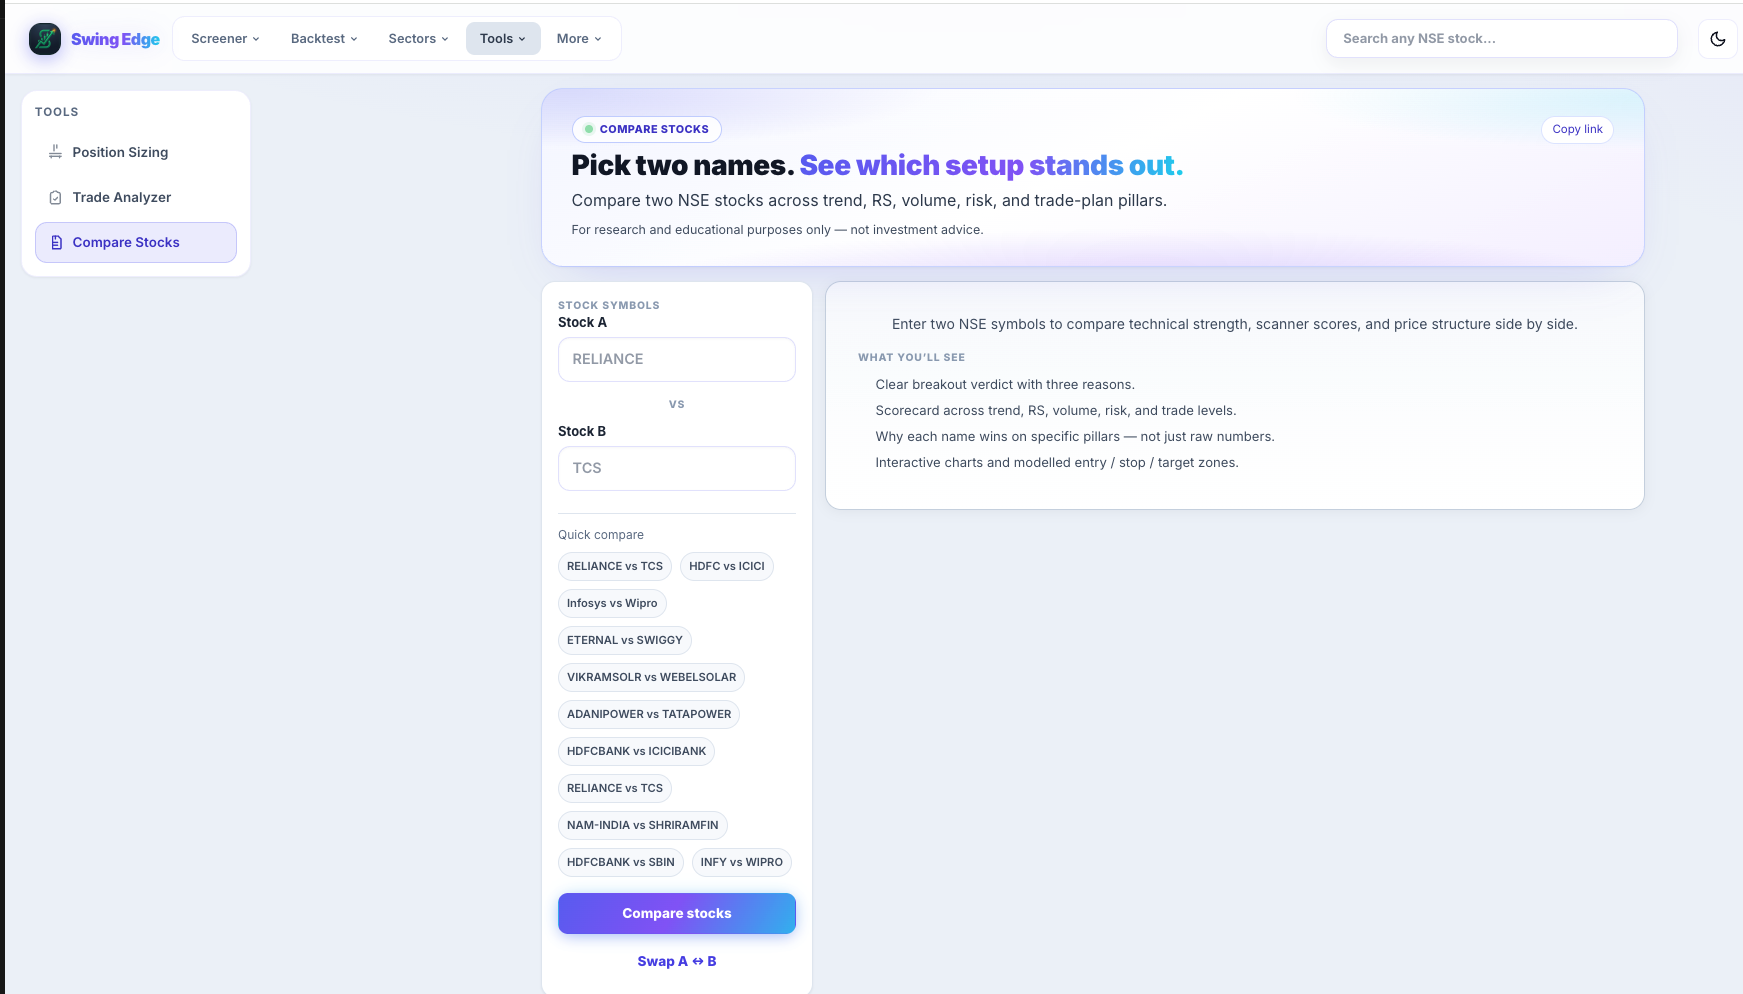
Compare Stocks tool
Two to four symbols on the same scan fields — side by side.
Page screenshot
Numbered markers highlight areas described in the steps below (desktop layout).
- Compare Stocks
- Stock A & B inputs
- Quick compare pairs
- Compare stocks button
- What you'll see
Screenshot coming soon
Add desktop.png under static/tutorials/compare-stocks/
Step-by-step
-
Add symbols
Search and add up to four NSE tickers. Remove or replace any slot.
-
Comparison table
Rows for total score, RS rank, RSI, stage, pivot distance, Vol Q, Fail risk, tags, and other scan fields from the same nightly snapshot.
-
Same scan date
All symbols compared as of the latest shared scan run — fair cross-section.
-
Scorecard comparison
The tool shows which name leads on each scan pillar — trend, RS, volume, risk, and trade levels. Research comparison only; you interpret the columns.
-
Links out
Each symbol links to its stock detail page for charts and history.
-
Use cases
Narrow a scanner shortlist, compare two bases in the same sector, or check RS vs peers.
Detailed reference
RS rank in compare
Percentile vs the full scan universe that night — useful for relative strength, not absolute quality.
Open in the app
FAQ
What does the Compare Stocks tutorial cover?
Two to four symbols on the same scan fields — side by side.
Is the Compare Stocks tutorial investment advice?
No. Swing Edge tutorials explain scan data and app features for your own research. They do not recommend buying, selling, or holding any security.
How do I get started with Compare Stocks on Swing Edge?
Add symbols: Search and add up to four NSE tickers. Remove or replace any slot.