Swing Edge Indicator page
One ranked table sorted by SEI — coiling, RS, volume, and extension in one score.
Page screenshot
Numbered markers highlight areas described in the steps below (desktop layout).
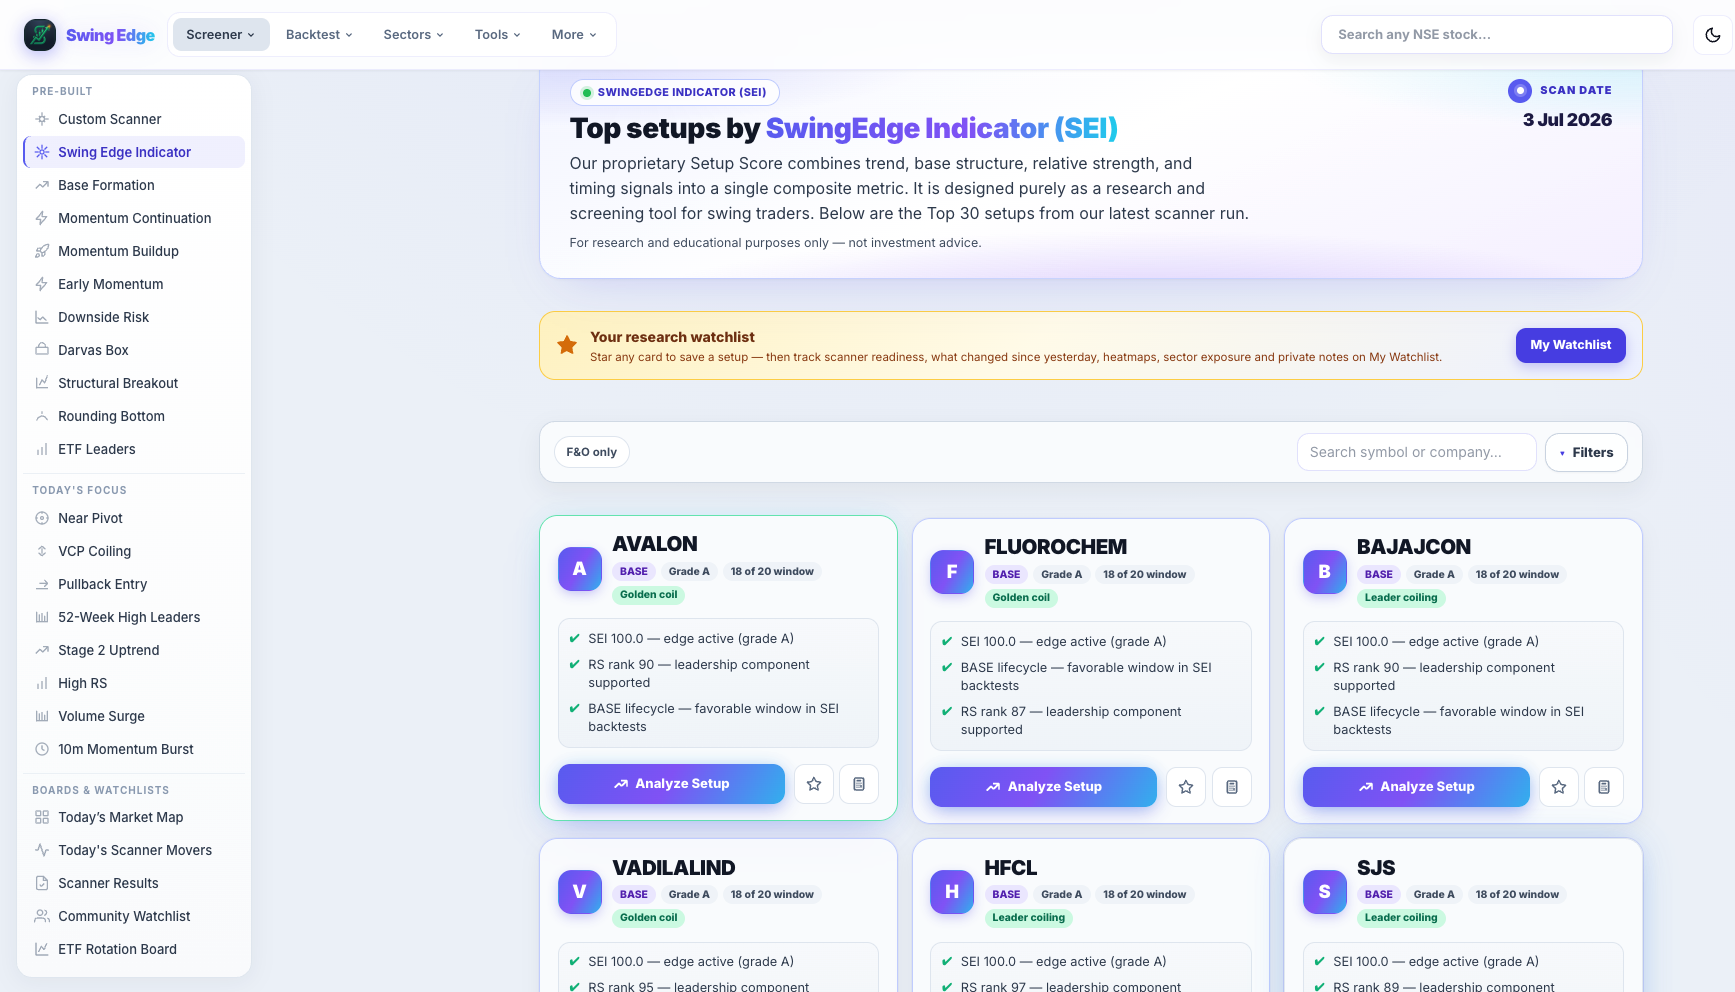
- Active screener (sidebar)
- Page hero
- F&O toggle & search
- Tags & scan notes
- Analyze Setup
Screenshot coming soon
Add desktop.png under static/tutorials/swing-edge-indicator/
Step-by-step
-
What SEI is
Swing Edge Indicator (SEI) is a 0–100 composite from the scan: coiling near pivot, RS trend, volume shape, and extension/chase flags. One number when you do not want to pick a pattern scanner first.
-
Table layout
Rows sorted by SEI descending. Columns include score, RS, phase, grade, and tags. Tap a row for the full stock page.
-
Phases & grades
Phase labels (e.g. coiling, breakout, extended) describe where price sits in the SEI framework. Grades are short letter bands from the score — context for sorting, not ratings.
-
SEI tags
Golden coil, Leader coiling, Chase risk, Extended leader, and others summarize sub-scores. See the tag list in Detailed reference below.
-
Filters
Narrow by phase, grade, or F&O like other scanners. Filters only affect what you see on screen.
-
Stock page SEI block
Every symbol with SEI data shows an expandable block on its detail page with history and tag breakdown.
-
When to use this page
When you want a single ranked universe without choosing Base Formation vs Buildup vs pattern scanners first.
Detailed reference
SEI score
0–100 blend updated nightly. Higher generally means tighter coiling with stronger RS and acceptable volume — minus extension penalties.
Example SEI tags
- Golden coil — tight range near pivot in the model.
- Leader coiling — strong RS with lighter volume.
- Chase risk — already moved up a lot recently.
- Extended leader — far from base in the model.
Fields on each card
Open in the app
FAQ
What does the Swing Edge Indicator tutorial cover?
One ranked table sorted by SEI — coiling, RS, volume, and extension in one score.
Is the Swing Edge Indicator tutorial investment advice?
No. Swing Edge tutorials explain scan data and app features for your own research. They do not recommend buying, selling, or holding any security.
How do I get started with Swing Edge Indicator on Swing Edge?
What SEI is: Swing Edge Indicator (SEI) is a 0–100 composite from the scan: coiling near pivot, RS trend, volume shape, and extension/chase flags. One number when you do not want to pick a pattern scanner first.