My Terminal page
Scanner names on the left, daily chart on the right — for end-of-day review.
Page screenshot
Numbered markers highlight areas described in the steps below (desktop layout).
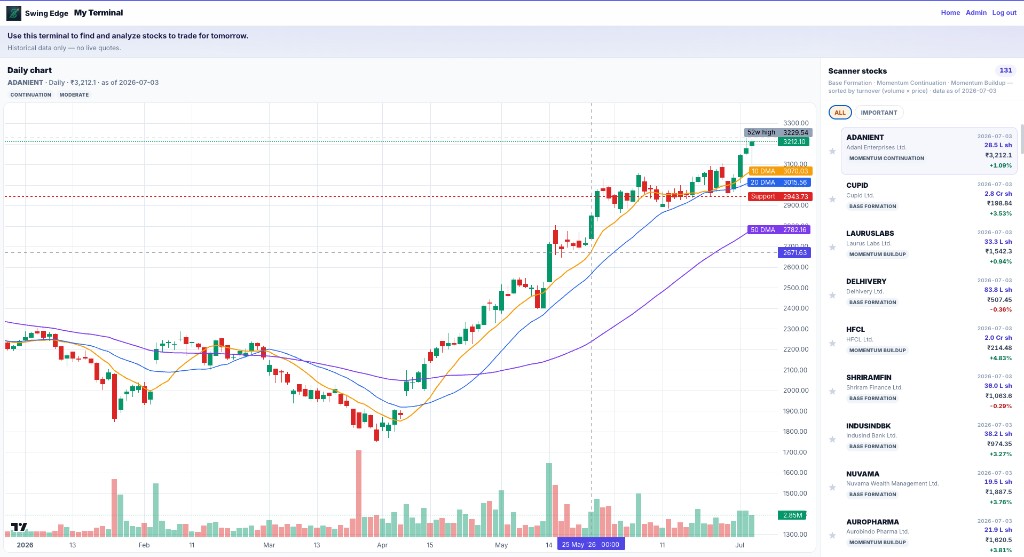
- Chart header & tags
- Daily chart
- DMA & support labels
- Scanner stocks list
- All / Important tabs
Screenshot coming soon
Add desktop.png under static/tutorials/my-terminal/
Step-by-step
-
What it is
A split-screen view for signed-in users. The list pulls from Base Formation, Momentum Continuation, and Momentum Buildup scans — sorted by turnover (volume × price).
-
Scanner stocks list
Tap a row to load its daily candlestick chart. Columns show symbol, score context, and turnover. Scroll the full merged list.
-
All vs Important tabs
All shows every row from the three scanners. Important is your short flagged list — max count enforced so it stays manageable.
-
Mark Important
Flag icons on rows add/remove from the Important tab. Your personal focus list, not a Swing Edge pick list.
-
Daily chart
Historical daily bars only — no live tick data. Review structure after the close alongside scan context.
-
Mobile layout
Scanner stocks and Chart tabs switch panels. Pick a symbol first, then open Chart.
-
Top bar
Home returns to the main app. Log out ends your session on this device.
Detailed reference
Important list
Mark symbols as Important to keep a smaller sub-list. This is your own flag for focus — not a recommendation from Swing Edge.
Turnover sort
Default list order uses turnover (price × volume) so the most actively traded scan names float to the top.
Data note
Charts and list fields use stored scan and price history. Refresh after new scan data if numbers look stale.
Open in the app
FAQ
What does the My Terminal tutorial cover?
Scanner names on the left, daily chart on the right — for end-of-day review.
Is the My Terminal tutorial investment advice?
No. Swing Edge tutorials explain scan data and app features for your own research. They do not recommend buying, selling, or holding any security.
How do I get started with My Terminal on Swing Edge?
What it is: A split-screen view for signed-in users. The list pulls from Base Formation, Momentum Continuation, and Momentum Buildup scans — sorted by turnover (volume × price).