
How to use the Swing Edge position sizing calculator
A step-by-step walkthrough of the trade planner — inputs, scanner context, results, and exit planning. Educational only.
By Ankur Jain, founder of Swing Edge · Educational research, not investment advice.
~22 min read
The position sizing calculator turns a chart idea into numbers: how many shares to buy, how much capital is at risk if your stop is hit, whether you are within a sensible allocation cap, and what a first profit target might look like in R-multiples. It does not tell you to buy or sell — it helps you plan risk before you enter.
Open the calculator
Try the tool with your own capital, entry, and stop — or open it from a stock page to load scanner context for that symbol.
Open position sizing calculator →Best way to start: from a stock page
The fastest workflow is to open the calculator from a stock you are already researching on Swing Edge. On the stock detail page, use Plan position size at the top or Plan this trade on the Daily Chart. Both links open the calculator with the symbol selected — you enter entry and stop yourself.
- ATR (when available) may load from the latest scanner row for that symbol.
- A scanner context card appears at the top with trade quality score, quality checks, sector RS, liquidity, volume ratio, and a suggested risk tier.
- Entry and stop loss are always yours to enter — the tool is a planner, not a lock-in order ticket.
- Works for names from Pre-Breakout, Active Breakouts, or any stock with saved scanner levels — not for generic chart-only pages without scanner data.
Manual alternative: open /tools/position-sizing and add ?symbol=RELIANCE (or any NSE symbol) to the URL. You can also type everything yourself if you are working from a broker chart.
Step 1 — Set your trade inputs
- Total capital deployed (₹): the pool you size from for swing trades (e.g. ₹10,00,000), not necessarily your entire net worth.
- Entry price (₹): your planned buy — breakout trigger, limit, or current price.
- Stop loss (₹): where the long idea is wrong; must be below entry for a standard long plan.
- ATR (₹), optional: typical daily range; the tool may suggest a stop near entry − 1.5×ATR when ATR is present.
Labels with a dotted underline are tooltips — hover on desktop or tap on mobile for a short explanation of each field.
Step 2 — Advanced mode (optional)
Toggle Advanced in the Trade inputs panel to expose finer controls. Defaults are sensible for most swing traders:
- Risk per trade (% of capital) — default 0.5% of deployed capital per trade.
- Max allocation per trade (%) — default 20% caps how much capital one stock can use.
- Gap buffer (%) — simulates a worse fill if price gaps through your stop overnight.
- Slippage (%) — assumes the stop fills slightly below your limit price.
Step 3 — Choose an exit style and run the plan
Exit style selects an educational template for profit-taking (fixed R:R with partial at +2R, partial at +1R, ATR trail, swing-low trail, EMA trail, or pyramid notes). Pick the style closest to your playbook, then press Plan This Trade. Results appear on the right (below on mobile).
Step 4 — Read the results
- Suggested trade plan — verdict line plus risk (1R), allocation %, max loss at stop, and first target.
- Risk (1R), Risk/share, Shares, Position value — share count is the minimum of risk-based sizing and allocation cap.
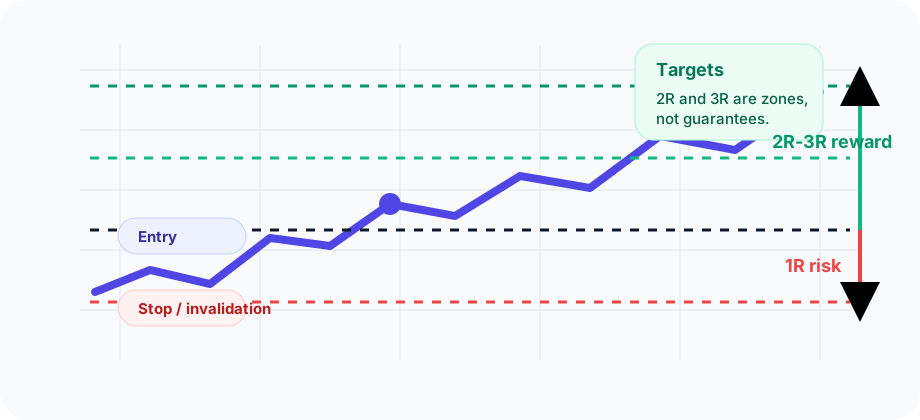
- Risk / reward map — red loss zone, entry marker, green gain zone to your first R target.
- Warnings — allocation cap binding, wide stop, or cannot size (widen stop, lower risk %, or add capital).
- Exit plan — numbered steps for your selected exit style.
- If the stop gaps through — extra loss estimate using your gap buffer % (educational stress test).
Understanding the scanner context card
When you arrive from a stock page, the banner under the hero shows the symbol, scanner type, signal strength, and a trade quality score (share of quality checks passed — not a buy rating). Green checks list what the scanner liked; grey dots are items that did not pass. Pills summarise sector RS, liquidity tier, volume ratio vs 50-day average, and a sizing hint (e.g. full 0.5% risk vs size down). Bearish-scanner names show a warning that long sizing is planning only.
A simple workflow to repeat every time
- Find a setup on Pre-Breakout or Breakouts (or open a stock from your watchlist).
- Open the stock page → Plan this trade.
- Confirm entry and stop match your chart; adjust if your invalidation is different from the scanner pivot.
- Review shares and 1R risk — if shares drop to zero, fix stop distance or capital before considering entry.
- Read exit steps and gap simulation; write your plan in a journal if you use one.
Common mistakes
- Treating calculator output as a recommendation to enter — it only sizes a plan you already chose.
- Skipping the stock page and re-typing levels from memory — easy to mismatch pivot vs your intended stop.
- Ignoring the allocation cap when shares look small — the cap is there to prevent one name from dominating the book.
- Using a stop inside normal daily noise on a volatile stock — check ATR and risk per share before committing.
- Forgetting gap risk on smallcaps around earnings — use Advanced gap % and the gap-through section.
Ready to plan a trade?
Open the calculator from a setup you are researching, or start blank and enter levels manually.
Go to position sizing tool →For deeper theory on R-multiples and trade plans, read the Trade plan & R-multiple lesson. For ATR-based stop distance, see ATR stops & sizing.